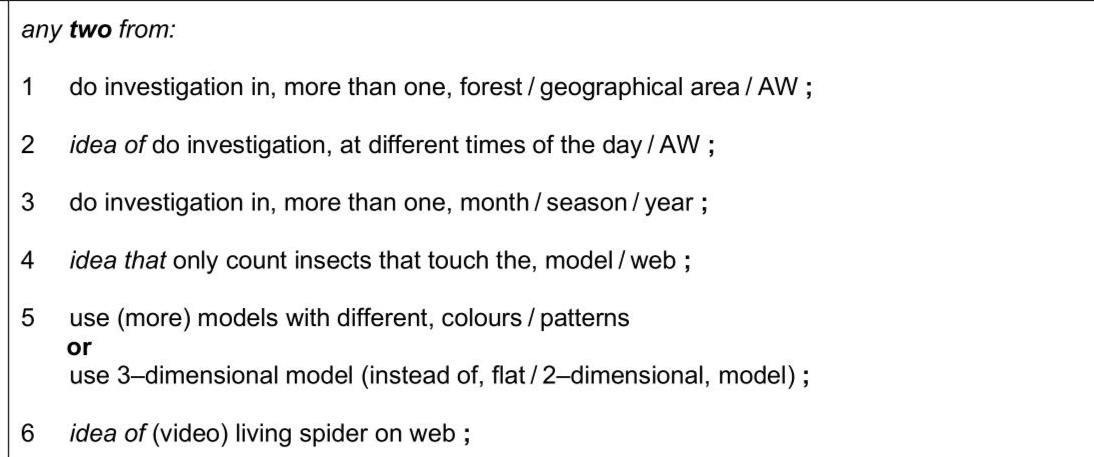
Golden orb weaver spiders,Nephila pilipes,are found in East Asia,South-east Asia and Australia. They are active in the day and at night.Golden orb weaver spiders build webs in trees and shrubs to catch different species of insects for food. All female golden orb weaver spiders are black with yellow spots on their legs and body.Biologists think that this adaptation evolved due to natural selection.Spiders with yellow spots may be able to attract more insects to their webs. Some biologists visited a forest in East Asia in July 2008.The biologists found five webs that were approximately the same size.Each web belonged to a female golden orb weaver spider. The biologists decided to investigate how the colour and pattern of spots on the spiders affect the number of insects attracted per hour to each web(insect attraction rate). The biologists made two-dimensional(2D)models of spiders,as shown in Table 2.1. At the first web, the biologists: - removed the living golden orb weaver spider from the web - placed model $$\(\mathbf{A}\)$$ in the centre of the web - placed a video camera 1 m from the web - filmed the web and model for 6 hours - recorded an insect attraction event whenever an insect flew towards the model, touched the model, or touched the web - calculated the insect attraction rate of model A. The procedure was repeated by placing models $$\(\mathbf{B}, \mathbf{C}, \mathbf{D}\)$$ and $$\(\mathbf{E}\)$$ on the four other webs. The whole investigation was repeated 25 times, and a mean insect attraction rate for each model was calculated. A student thought that the investigation did not provide enough information about how the colour and pattern of spots on female golden orb weaver spiders help to attract insects to their webs. Suggest how this investigation could be improved to increase confidence in the results. . . .
Exam No:9700_s25_qp_51 Year:2025 Question No:2(c)
Answer:
Knowledge points:
17.2.1 explain that natural selection occurs because populations have the capacity to produce many offspring that compete for resources; in the ‘struggle for existence’, individuals that are best adapted are most likely to survive to reproduce and pass on their alleles to the next generation
17.2.2 explain how environmental factors can act as stabilising, disruptive and directional forces of natural selection
17.2.3 explain how selection, the founder effect and genetic drift, including the bottleneck effect, may affect allele frequencies in populations
17.2.4 outline how bacteria become resistant to antibiotics as an example of natural selection
17.2.5 use the Hardy–Weinberg principle to calculate allele and genotype frequencies in populations and state the conditions when this principle can be applied (the two equations for the Hardy–Weinberg principle will be provided, as shown in the Mathematical requirements)
17.2.6 describe the principles of selective breeding (artificial selection)
17.2.7.1 the introduction of disease resistance to varieties of wheat and rice
17.2.7.2 inbreeding and hybridisation to produce vigorous, uniform varieties of maize
17.2.7.3 improving the milk yield of dairy cattle
18.2.1 define the terms ecosystem and niche
18.2.2.1 the number and range of different ecosystems and habitats
18.2.2.2 the number of species and their relative abundance
18.2.2.3 the genetic variation within each species
18.2.3 explain the importance of random sampling in determining the biodiversity of an area
18.2.4 describe and use suitable methods to assess the distribution and abundance of organisms in an area, limited to frame quadrats, line transects, belt transects and mark-release-recapture using the Lincoln index (the formula for the Lincoln index will be provided, as shown in the Mathematical requirements)
18.2.5 use Spearman’s rank correlation and Pearson’s linear correlation to analyse the relationships between two variables, including how biotic and abiotic factors affect the distribution and abundance of species (the formulae for these correlations will be provided, as shown in the Mathematical requirements)
18.2.6 use Simpson’s index of diversity (D) to calculate the biodiversity of an area, and state the significance of different values of D (the formula for Simpson’s index of diversity will be provided, as shown in the Mathematical requirements)
Solution:
Download APP for more features
1. Tons of answers.
2. Smarter Al tools enhance your learning journey.
IOS
Download
Download
Android
Download
Download
Google Play
Download
Download