
The histogram gives information about the times, in minutes, some customers had to wait to be served in a restaurant. 14 customers had to wait less than 10 minutes to be served. Work out the number of customers who had to wait less than 60 minutes to be served.
Exam No:4MA1_2HR_que_20201106 Year:2020 Question No:21
Answer:
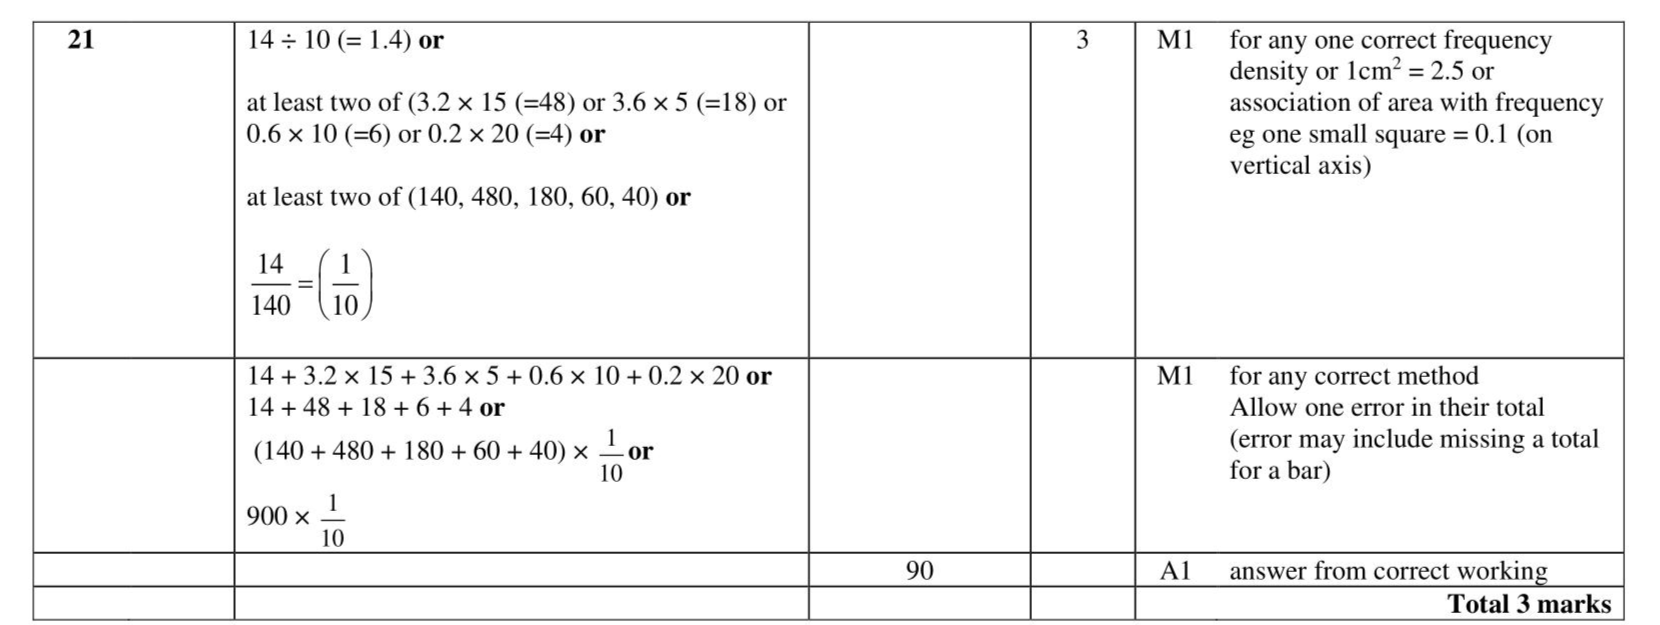
Knowledge points:
6: Statistics and probability
Solution:
Download APP for more features
1. Tons of answers.
2. Smarter Al tools enhance your learning journey.
IOS
Download
Download
Android
Download
Download
Google Play
Download
Download