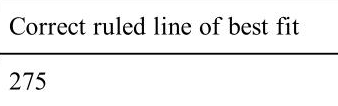
The scatter diagram shows the price of petrol per litre and the number of litres sold at a petrol station on each of ten days. On the scatter diagram, draw a line of best fit. (ii) One day the price of petrol was $$\(\$ 1.55\)$$ per litre. Use your line of best fit to estimate the number of litres sold. ..................................... litres
Exam No:0580_s25_qp_11 Year:2025 Question No:20(c)
Answer:
Knowledge points:
C1.5 Use the language and notation of simple vulgar and decimal fractions and percentages in appropriate contexts. Recognise equivalence and convert between these forms
Solution:
Download APP for more features
1. Tons of answers.
2. Smarter Al tools enhance your learning journey.
IOS
Download
Download
Android
Download
Download
Google Play
Download
Download